World Oil Consumption
The EIA publishes oil consumption numbers for all major nations. However they have data for most nations only through 2013. They do have data for some nations through 2014.
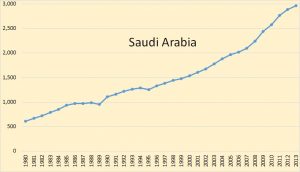
Saudi Arabia, by far the Middle East’s largest consumer, has increased consumption every year since 1995. But actually in 1990 and 1995 it’s decreasing a little bit but it’s always continue to increase again. It’s always increasing since 1980 until 2013 and the highest amount of oil consumption is on the recent one, 2013.
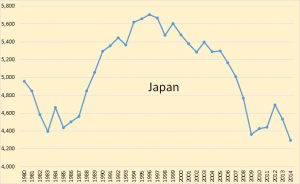
Japan has been in the doldrums for almost two decades. Their oil consumption peaked in 1996 at 5,704,000 barrels per day. They recovered slightly in 2012 but dropped again in 2013 and 2014, reaching a low of 4,297,000 barrels per day in 2014. That is a decline of almost 25 percent. In 1085 until 1993 it’s constantly increasing. The highest one is on 1996. And it’s constantly decreasing in 2005 until 2009. The lowest amount is on the recent one, 2014 with 4300 barrels of oil consumption.
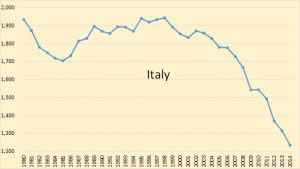
In Italy, oil consumption peaked in 1998 and has dropped 36.4 percent, over one third. We can see the unstable chart of the oil consumption in Italy but you can see it’s more like decreasing every year than increasing. As we can se on the chart above, it’s constantly decreasing since 2002. Based on the chart, the highest amount of the oil consumption of Italy was on 1980, and the lowest one is in the recent one, 2014.
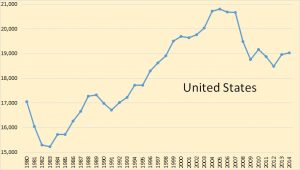
US held peak oil consumption at around 20,700,000 barrels per day from 2004 through 2007, dropped in 2008 and 2009 but increased since then. US consumption in 2004 stood over 19 million barrels per day, down about 8 percent since the four year peak period. The recession has not hit the US nearly as hard as it has hit Europe.


Recent Comments